GNU Debugger (GDB)
Introduction
A debugger is a program that runs other programs, allowing the user to exercise control over these programs, and to examine variables when problems arise. GDB allows you to run the program up to a certain point, then stop and print out the values of certain variables at that point, or step through the program one line at a time and print out the values of each variable after executing each line.
Errors like segmentation faults may be easier to find with the help of gdb.
GDB allows you to:
- Pause and continue its execution
- Set "break points" or conditions where the execution pauses so you can look at its state (the value of the variables at that point).
- View and "watch" variable values
- Step through the program line-by-line (or instruction by instruction)
Installation
Before you install GDB, check whether you have already installed it.
$ gdb -helpIf you have already installed GDB, then it will display all the available options within your GDB. Else if the terminal says "command not found", then you can proceed with the installation process.
$ sudo apt-get update$ sudo apt-get install gdbNow you can confirm the installation of GDB by executing the command $ gdb -help again.
Demo
Let us demonstrate a common use case: finding an infinite loop in a C program.
Let's say we have a program that builds a linked list and then prints it. However, the program has a bug and accidentally creates a cycle in the list, causing the printList function to loop forever.
This is our C file:
expserver/list_demo.c
#include <stdio.h>
#include <stdlib.h>

struct Node {
    int data;
    struct Node* next;
};

void printList(struct Node* head) {
    struct Node* current = head;
    printf("Attempting to print list:\n");

    while (current != NULL) {
        printf("%d -> ", current->data);
        current = current->next;
    }

    printf("NULL\n");
}

int main() {

    struct Node* head   = (struct Node*)malloc(sizeof(struct Node));
    struct Node* second = (struct Node*)malloc(sizeof(struct Node));
    struct Node* third  = (struct Node*)malloc(sizeof(struct Node));

    head->data = 10;
    head->next = second;

    second->data = 20;
    second->next = third;

    third->data = 30;

    third->next = second;


    printf("Calling printList...\n");
    printList(head);

    printf("List printing complete.\n");

    free(head);
    free(second);
    free(third);

    return 0;
}
It contains:
- A
struct Nodedefinition (withint dataandstruct Node* next). - A
printList(struct Node* head)function that iterates through the list and prints each node's data. - A
mainfunction that builds a list (e.g., 10 -> 20 -> 30) but then incorrectly sets the 3rd node'snextpointer back to the 2nd node, creating a20 -> 30 -> 20...cycle.
We know that by manual tracing, the list should be: 10 -> 20 -> 30 -> NULL.
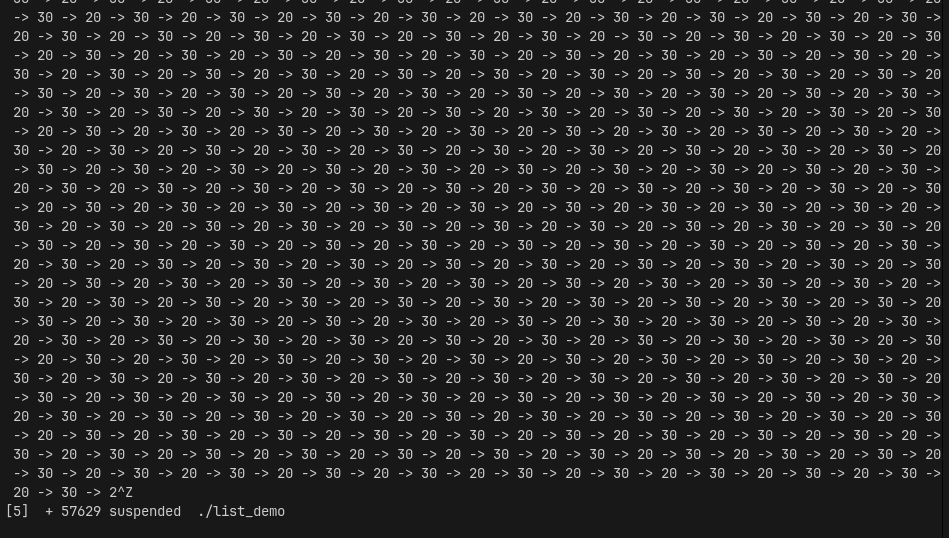
But the buggy program creates:
10 -> 20 -> 30 -> 20 -> 30 -> 20 -> ...
Now let us start our GNU debugger.
First, we compile our C file using the -g flag of gcc. This flag preserves the symbol table, allowing GDB to show us our function and variable names, which is crucial for debugging.
$ gcc -g list_demo.c -o list_demoNow, an executable file list_demo is generated. We run it inside GDB:
$ gdb ./list_demoNow our GDB is up.
layout src - Opens a Graphical user interface, where you can view the part of the code currently executing along with the code line numbers.
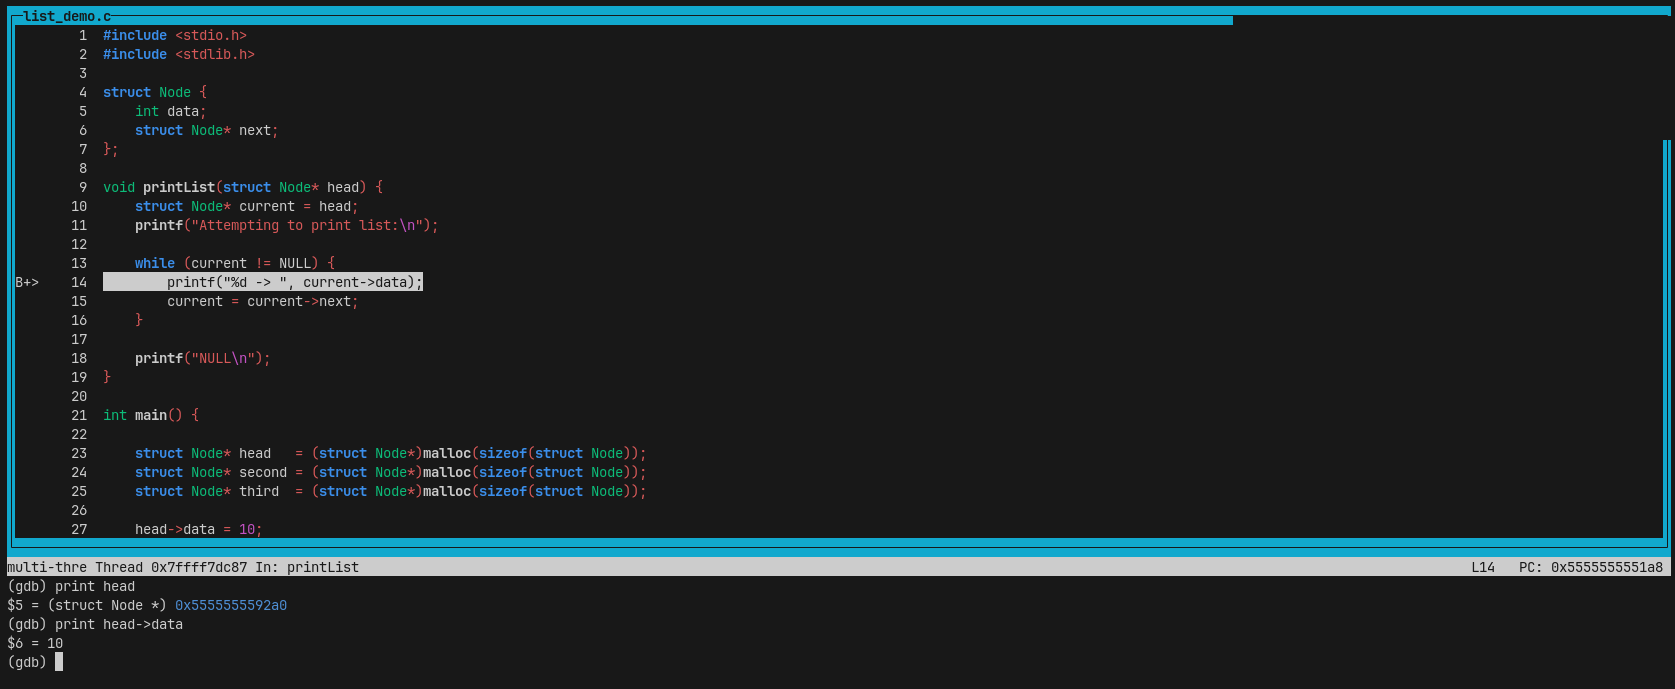
(gdb) layout srcbreak - You can pass a function name or line number as an argument. The program will halt when it reaches that point.
We know the program hangs, and we suspect the printList function is the problem. Let's set a breakpoint there.
(gdb) break printListYou can also set a breakpoint on a specific line number. This is useful if you know exactly which line you want to stop at.
(gdb) break list_demo.c:14- This sets a breakpoint at line 14 of
list_demo.c, pausing execution whenever that line is about to run.
Alternatively, you can set a breakpoint by line number alone:
(gdb) break 14- This sets a breakpoint at line 14 of the “current” source file.
- The current file is usually:
- The file where execution currently is, or
- The file you last viewed using
listorlayout src.
Using breakpoints lets you pause execution at critical points and inspect variables to debug your program effectively.
run - It runs the program until it encounters one of the break points.
(gdb) runNow, we would have stopped at the start of the execution of the function printList. This function has a head variable pointing to the start of our list.
next or n - To move to the next line in the local scope (it "steps over" function calls).
Let's use next to step through the while(current != NULL) loop in our printList function and watch the current pointer's data.
(gdb) next
(gdb) print head->data
$1 = 10
(gdb) next
(gdb) print current->data
$2 = 20
(gdb) next
(gdb) print current->data
$3 = 30
(gdb) next
(gdb) print current->data
$4 = 20
Aha! We've seen the value 20 before. This confirms our program is stuck in a loop, oscillating between the nodes 20 and 30.
print - You can use this to print the value of the variables at that point.
The break statement helped us to reach the interested target function, and next with print helped us confirm the infinite loop.
Now let us verify where the loop is by inspecting the pointers directly from the head.
(gdb) print head->data
$5 = 10
(gdb) print head->next->data
$6 = 20
(gdb) print head->next->next->data
$7 = 30
(gdb) print head->next->next->next->data
$8 = 20
This confirms that the node with data 30 points back to the node with data 20.
continue - To run until you encounter the next breakpoint.
Since the printList function iterates through the list with a while loop, we can set a breakpoint on a line inside that loop (e.g., line 14, printf("%d -> ", current->data);).
(gdb) break 14
Breakpoint 2 at 0x...: file list_demo.c, line 14.
(gdb) continue
Continuing.

Breakpoint 2, printList (head=...) at list_demo.c:14
(gdb) print current->data
$1 = 10
(gdb) continue
10 ->
Breakpoint 2, printList (head=...) at list_demo.c:14
(gdb) print current->data
$2 = 20
Here we found the node with data 20 after the node with data 10, as expected.
...and so on. By continuing this process of using print current->data and continue, we can traverse the entire linked list node by node and verify its structure, which will quickly reveal the infinite loop when we see 20, then 30, then 20 again.
An alternate way is to set a watchpoint.
watch - You can use a watchpoint to stop execution whenever the value of an expression changes, without having to predict a particular place where this may happen.
(gdb) watch currentGDB will monitor the value of the current pointer, and whenever the value of the variable current changes (when head points to a different node), gdb halts the execution, and prints the old value and the new value of the current variable.
Infinite Loop
One of the important use cases of GDB is when we encounter a segmentation fault or infinite loop. In such situations, using GDB to debug the code, and identify what went wrong is invaluable. It can save a significant amount of time and effort in troubleshooting these complex errors.
In this example, we can see an infinite loop. Let us see how we can use GDB to find the exact error in our linked list structure.
Let us print the memory addresses of the nodes.
(gdb) print head->next
$9 = (struct Node*) 0x555555563920
(gdb) print head->next->next
$10 = (struct Node*) 0x555555563940
(gdb) print head->next->next->next
$11 = (struct Node*) 0x555555563920
As we can see, the address of head->next (the '20' node) is the exact same as the address of head->next->next->next (what the '30' node points to).
Let's ask GDB to compare them directly:
(gdb) print head->next == head->next->next->next
$12 = 1
The result 1 means true. We have definitively proven that a cyclic pointer exists and is the cause of our infinite loop.
Now, we will remove the loop live in GDB to confirm our fix.
set var - This command is used to modify the current value of a variable.
We will use set to change the next pointer of the '30' node to NULL (which is 0x0), as it should be.
(gdb) set head->next->next->next = 0x0Now that the loop is broken, let's clear our breakpoint and continue execution.
(gdb) clear printList
Deleted breakpoint 1
(gdb) continue
Continuing.
10
20
30
[Inferior 1 (process 12345) exited normally]
Success! We have removed the cyclic loop, and set the next pointer of the node '30' to NULL. When we resumed our program, it printed the list correctly and "exited normally", which confirms that the cyclic loop was the only error.
GDB, thus, helps us to find the root cause of complex bugs and even test fixes live, saving a lot of time.
Commands
Some of the important GDB commands are:
layout next: Opens a Graphical user interface.start: Starts debugging from top, and gives control to user.break: Sets a break point at a function or line number.continue: Runs until the next breakpoint is encountered.run: Runs the program until it encounters a breakpoint.nextorn: Steps over to the next line in the current scope.stepors: Steps into a function call.print: Prints the value of a variable.set var: Modifies the current value of a variable.quit: Stops the debugging process.refresh: Restarts the debugging process from the top.clear: Clears set breakpoints.backtrace full: Shows a summary of how your program got where it is (useful for segmentation faults).watch: Stops execution when the value of an expression changes.rwatch: Stops execution when an expression is read.awatch: Stops execution when an expression is read or written to.info watch: Prints a list of watchpoints.info break: Prints a list of breakpoints.list: Lists the source code around the current line.delete {val}: Deletes a watchpoint or breakpoint by its number.x {var_name}: Shows the memory location and value of a variable.
Some Important Commands in Detail
Run
(gdb) runBreak
(gdb) break my_file_1.c:5Watch
(gdb) watch my_varConditional Breakpoints
(gdb) break my_file_1.c:5 if i >= SIZE_OF_ARRAYPointer Operations
- See the pointer's memory address:
(gdb) print struct_pointer- See a specific field of a struct:
(gdb) print struct_pointer->name- Use dereference (
*) and dot (.) operators:
(gdb) print (*struct_pointer).name- See the entire contents of the struct:
(gdb) print *struct_pointer- Follow pointers in a sequence (like a linked list):
(gdb) print list_prt->next->next->next->data