
Introduction
This guide walks you through the eXpServer-Testbench platform — a solution designed to simplify and automate the process of testing server-side applications in a controlled and insightful environment.
This platform is especially useful for developers, students, and educators who are working on low-level network or systems programming and want a streamlined way to test compiled binaries with predefined test cases, real-time logs, and system resource monitoring.
With an intuitive interface and modular structure, eXpServer-Testbench provides a complete testbench environment where you can:
- Upload and manage your compiled binary files.
- Run tests that simulate realistic client-server interactions.
- Monitor system performance metrics like CPU and memory utilization.
- View real-time server logs and test case status.
- Understand detailed reasons for test failures via contextual modals.
The platform is divided into several sections, each with a clear and focused purpose. You’ll find side navigation to easily switch between these sections:
- Overview – Get a summary of the test layout and main functionalities.
- Console – See live server logs during the test execution.
- Execution – Upload, run, and monitor your tests and system usage.
- Testcase – View individual test cases, their status, and failure insights.
- Failed Modal – Explore detailed reasons for failures to debug your binary effectively.
Whether you're testing a basic TCP echo server or evaluating a multi-threaded server under load, this platform will guide you through the process, ensuring clarity, traceability, and efficiency at every step.
Let’s get started!
Overview
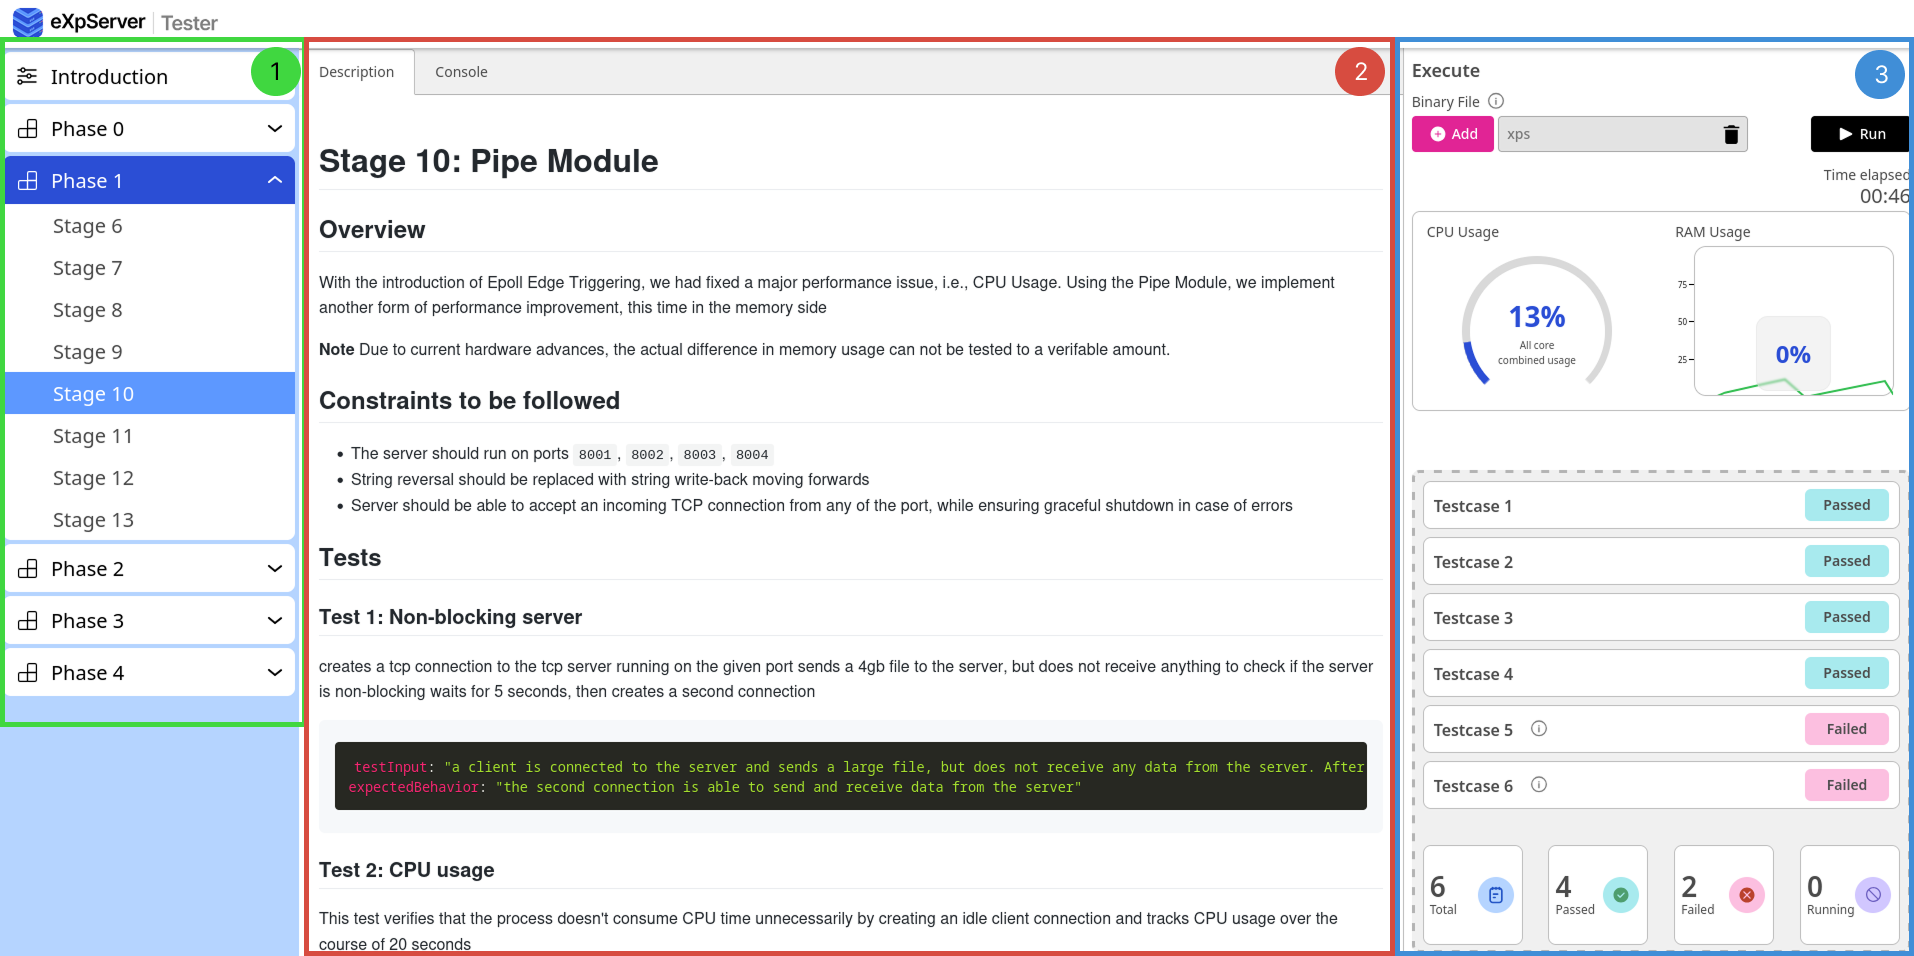
- On the left, there is a sidebar which can be used to toggle between phases and stages.
- In the center, there is a detailed test description which explains what will be tested and the expected behavior.
- On the right, there is an execution tab where you can upload a compiled binary file, run it, and see the real-time test status and results.
Console
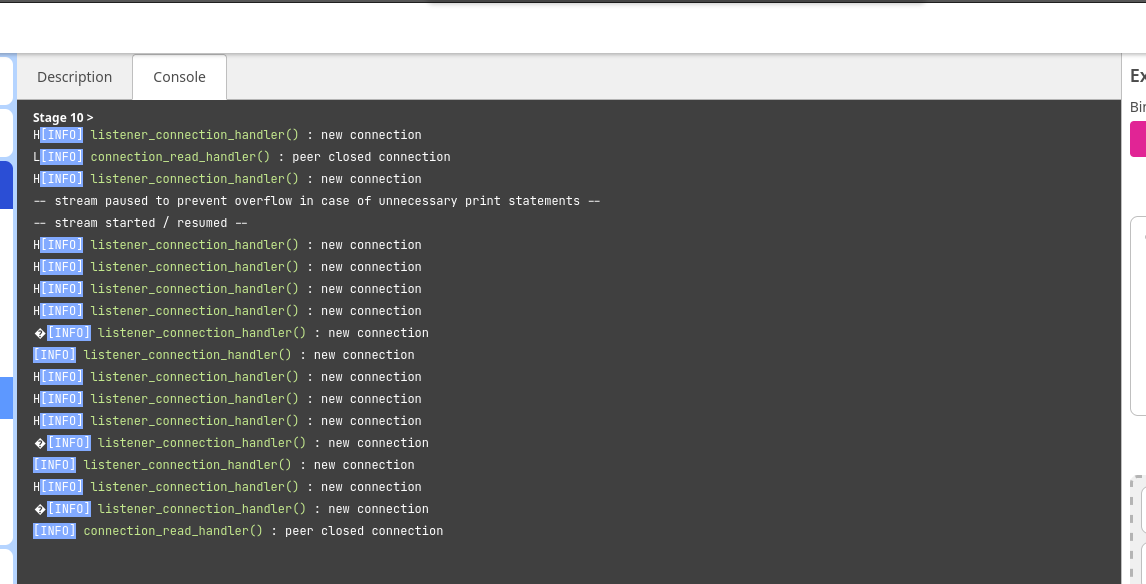
If you check the center part, at the top you can toggle between the Test Description and the Console tabs.
The Console displays real-time server logs while the test is running.
Execution
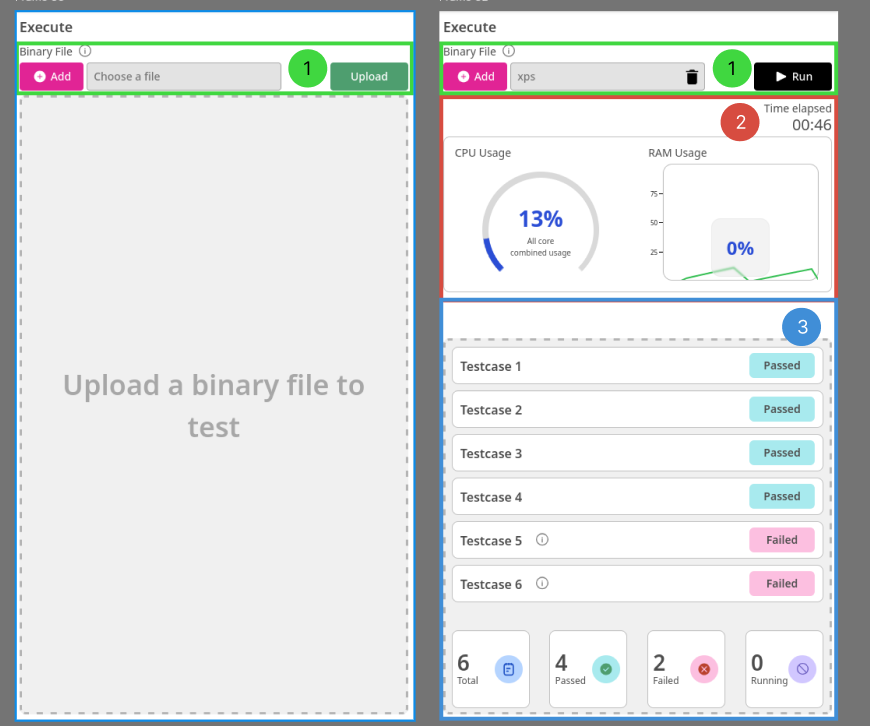
On the left, we have the execution section:
- You can add and delete the binary file. After adding the binary file, press "Run" to run the test.
- The Resource Monitor section shows real-time CPU and memory utilization. It also displays the time taken by the test to run in the backend.
- Another section shows the real-time test status: Pending, Running, Passed, or Failed. At the bottom, you’ll find the overall test results.
Testcase
- Displays the test case number and its status.
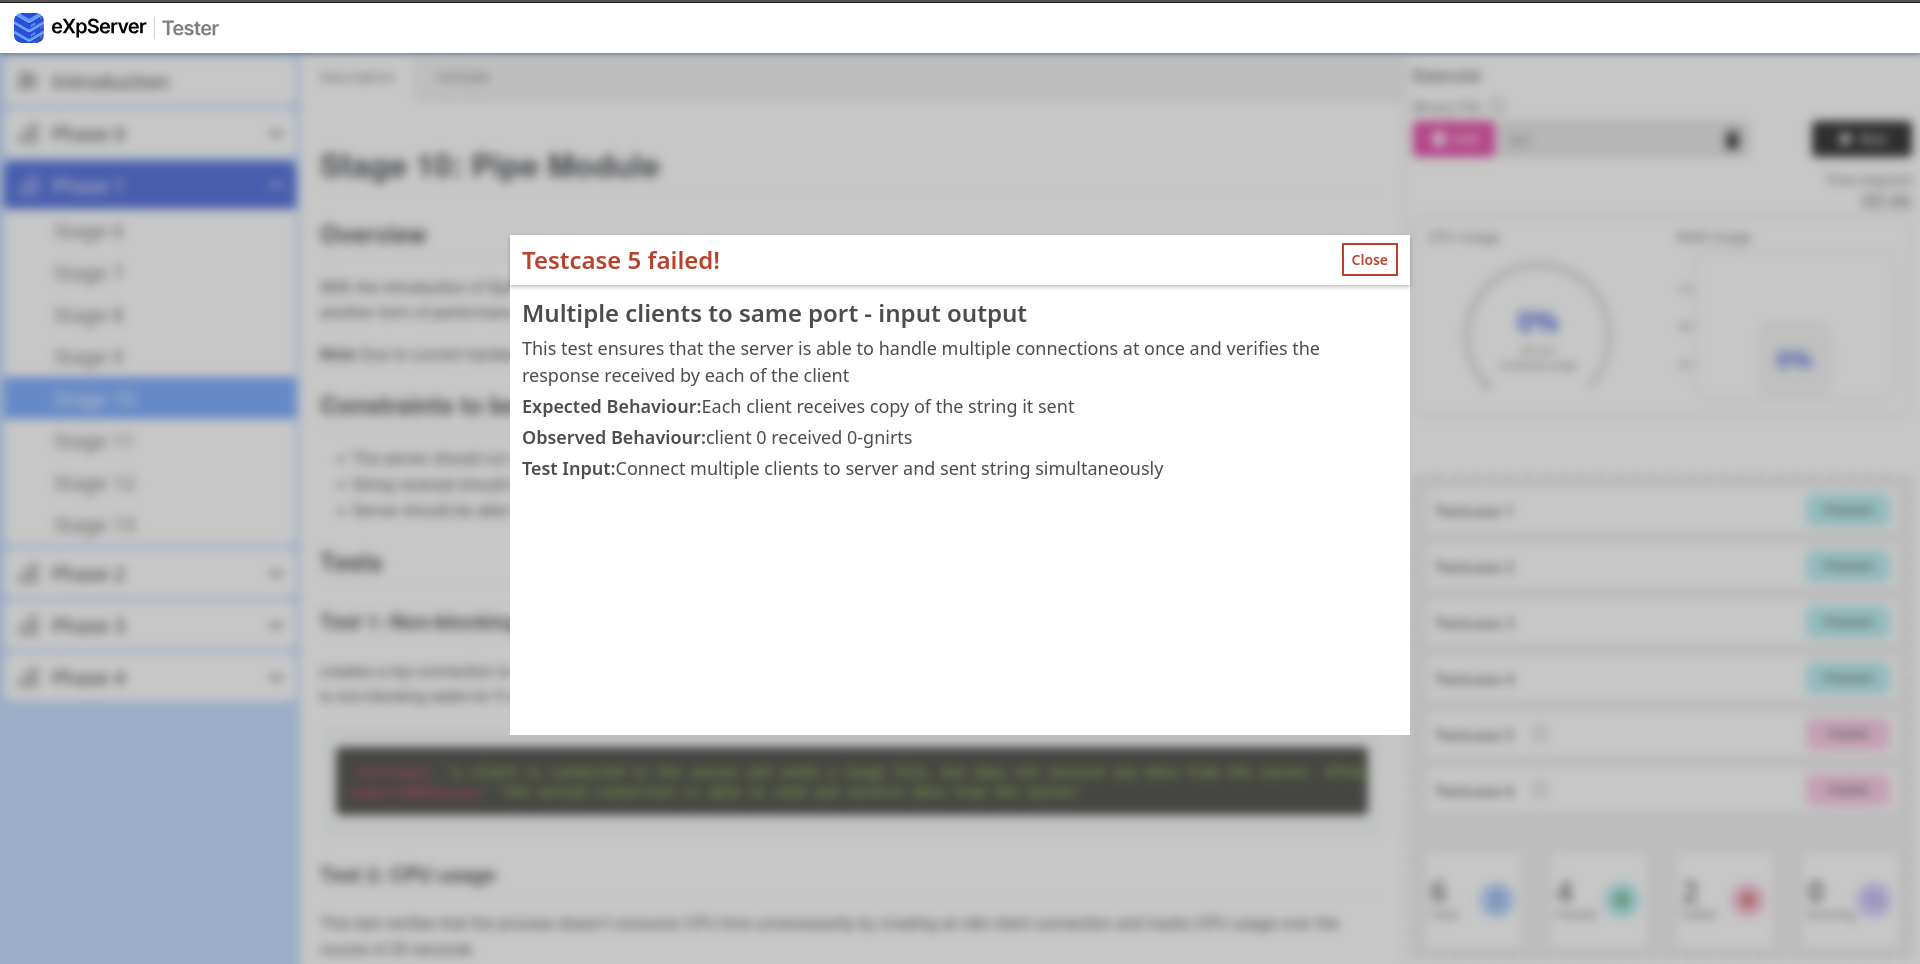
- If a test fails, an "info" icon appears next to the test case number. Clicking this icon opens a modal that describes possible reasons why the test might have failed.